Navigating a Solar Plant
Landing page
When first logging in, there will be a landing page with key sections for reports, observations, tasks, and direct access to the related solar plant. This will show an aggregation of data for all solar plants you have access to.
To see more information, either click on any link in each section or click on the Solar Plants link in the left menu to see a dashboard directly related to the solar plant of choice.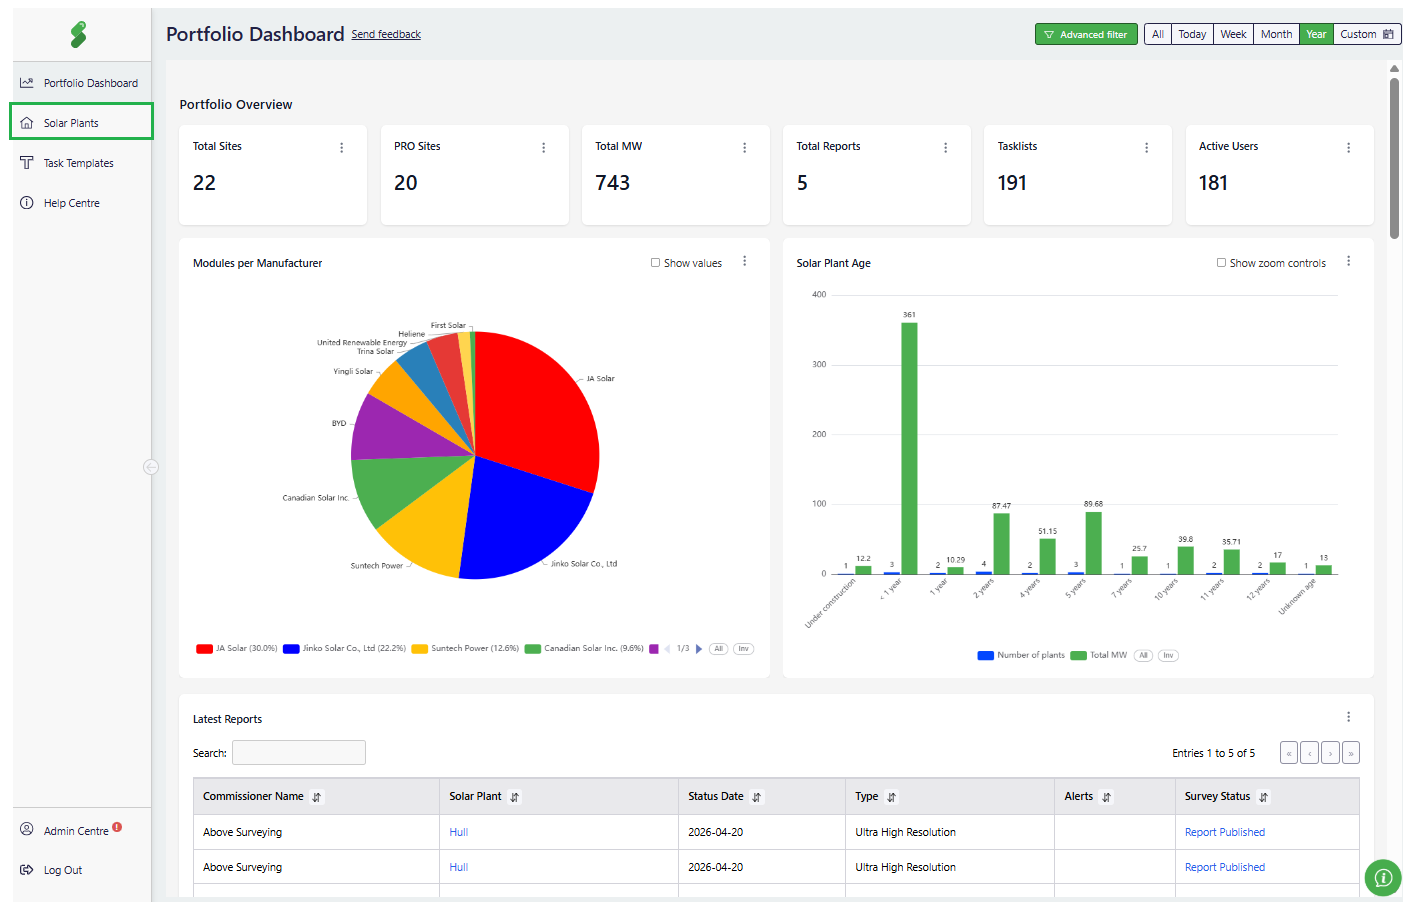
How to access reports
Reports can be accessed from 2 places:
- The solar plant dashboard, from the Latest Reports section
- The report can be accessed by clicking on the "Report Published" link in the specific row
- The report page, by clicking on Reports in the Left menu
Thermographic reports
Within the report several insights are available including power loss estimation, a breakdown of anomaly types and temperature analysis.
How to use the side navigation bar
The side navigation bar can be accessed at any point by hovering over it with your cursor. Using the navigation bar, you can access all of the solar plant's reports and additional data tools that will benefit you and your solar plants.
The Survey Compare tool allows you to compare multiple historic Thermographic & HD inspection reports from this solar plant.
How to access Task Lists
Task lists tool allows you to create a targeted list of module anomalies from your inspection report, as well as view and edit existing task lists. You can access each list by clicking on the row to open more detail.
Within a task list more detail can be viewed including the anomaly status, task and details of each anomaly alongside a map of the site.
How to access Digital Twin
The Digital Twin tool is an accurate model of your solar plant that understands both the geospatial and the electrical layout of the plant. This tool is only accessible with a SolarGain Pro subscription.
From here you can get detailed information by clicking on any component.
To return to the dashboard, simply click the solar plant name in the side navigation bar.
The data can be filtered by clicking on the charts. This selection will affect the data in the other areas as well. This example shows the Task status as being "Failed" and will display data for Tasks with the status "Failed" only.
Some charts allow "cross-filtering" which means that clicking on part of the chart will change the data and display the filter on top. To clear the filter, click the pill on the upper left corner to clear the filter. Cross-filtering has an icon next to chart title. Individual charts can still be filtered by clicking on the legend, but it only changes the chart.
Visit the SolarGain FAQ's page for more information. Additionally, you can request further support below or contact your Technical Account Manager (TAM).
Related Articles
Managing Solar Plants, Regions and Users in Admin Centre
Overview This article explains how to add, edit and share solar plants, regions and users within the SolarGain portal. Only users with admin rights can access this functionality. Please click through the following demo tool to learn more about using ...Software Release Notes
Release 23 June CLIENT PORTAL Admin Centre Added exact-match organisation search functionality. Development & Construction Component progress can now be updated on the map Observations Image uploads now use the date the picture was taken instead of ...Getting Started with SolarGain Navigation
How to log in to SolarGain To access SolarGain navigate to: https://portal.abovesurveying.com To log in use the credentials that were provided to you. What to expect on the Portfolio Dashboard Once logged in you will be greeted with the SolarGain ...Site Digital Set Up - Components onboarded for each service
SolarGain is a cloud-based platform built specifically for the solar industry. It integrates all test, inspection, and operational data into a single digital environment, creating a comprehensive health record for your solar assets. Here is a list of ...Admin Centre FAQ’s
Overview What can I do in the Admin Centre as an Admin? As a user with an Admin role, you can manage your organisation’s solar plants, regions, and users directly within the Admin Centre, without needing to contact Above Surveying. You can also view ...